Data
a. Currently 139 crops/landraces are listed in our database some of them are labelled as ‘underutilised’ and some of them are crops that are growing in Bera district Malaysia (mostly fruits and vegetables). We use collected data on these crops to showcase the ‘diversification tool’.
b. We are in the process of enhancing our taxonomic backbone (data about species and landraces names) by integrating taxonomic data from major databases like USDA GRIN and Global Biodiversity Information Database (GBIF). This taxonomy data that amounts to more than 100K species names will be integrated in the next iteration of the database.
a. The data is collected using variety of methods to cover value chain of crops;
i. Manual data collection using available literature online and offline. The data is entered by data collectors using an online curation system (LINK). Metadata, including references, location, images, notes and ‘reliability flags’ will also be collected for the purpose of curation and validation.
ii. We have identified quite a few databases that can supply the information we need and we are in the process of linking and integrating data from those databases. These database include, FAO EcoCrop on ecological characteristics of ~2700 crop species, Food Plants International data on ~7000 nutritious crop species around the world, AVRDC nutrition database on ~60 vegetables. We also have partnership with Malaysian institutes like Malaysian Agricultural Research and Development Institute (MARDI), and International Tropical Fruit Network (TFNet) that will supply the local data needed for this project.
iii. Ground data (mostly socio-economics information) are collected by contacting local authorities. Also, we are in the process of developing standard questionnaires to collect local and farmers’ data.
a. Gap filling using available data will be done at three levels (is not integrated in the database yet);
i. Closest relatives (at both genotypic of the phenotypic levels)
ii. Data from the nearest location for the same crop
iii. Available data from the next reliable source
a. The data that is collected from variety of sources will need to be validated by experts both within and out outside the centre. We will demonstrate the data reliability flags in the next iterations of the database.
b. Experimental data and the data collected by CFF personnel will be added to the database in the next iteration of the tool.
a. For the purpose of comparison.
b. In order to show the areas that underutilised crops can complement and solve local problems and where major crops can or will perform sub-par.
a. We have a curation system that will be open to the experts and users to curate and validate the data after the data is collected.
b. We will provide the source and reliability criteria for all of the data that is used for any analysis so that inconsistencies and errors can be flagged and reported.
Our team of socio-economic experts have initiated a task force that includes local farmers and representatives of the government organisations working in this area to review the system and provide feedback.
a. The climate data for this iteration of the tool comes from WorldClim is a set of global climate layers (climate grids) with a spatial resolution of about 1 square kilometer (Hijmans, R.J., S.E. Cameron, J.L. Parra, P.G. Jones and A. Jarvis, 2005. Very high resolution interpolated climate surfaces for global land areas. International Journal of Climatology 25: 1965-1978.)
b. We use “average monthly mean temperature (°C )” and “Average monthly precipitation (mm)” to calculate the climate suitability index.
We use the relatively basic crop environmental requirements information (Temperat. requir., Rainfall (annual) and Crop cycle data) from the FAO EcoCrop database (http://ecocrop.fao.org/ ) What other environmental
We will implement ‘soil suitability’ in the next iteration of the tool. The data will be supplied from global databases for now. However we will have capacities in the system to include local high resolution climate and soil datasets.
Application
Use this address: http://cropbase.org/cropbase/tools/DivTool/
Or simply go to CropBASE landing page and click on “Tool:: Go to site”.
We take the optimum ecological limits (minimum and maximum temperature and rainfall that a crop needs in order to properly grow) and compare it with the local minimum and maximum temperature and cumulated rainfall for the duration of season (calculated monthly). After the calculations we come up with a suitability index from 0 to 100 for a specific crop at a specific location. We then combine this index with other information to provide a total suitability index at that location.

Error in the results can have two sources; data and calculations. Both of these types of error should be corrected through iterative checking of the results by the experts. An expert validation tool is envisaged for the next iteration of the database.
- The climate data is from a global dataset that uses many covariates to predict for the monthly data. There could be recalculation problem for estimating climate data at some locations.
- The environmental limits (optimum and absolute temperature and rainfall) as well as the length of growing season are taken from EcoCrop dataset on ecological limits of crops. There could some misrepresented data in that database.
- Calculations can also go wrong in some areas where the data is in the incorrect format.
- There could be some miss-calculations for climate index for some crops. As a result of this error, some visualisation problems can occur on the resulting map. These will be address in the next iteration.
The maps are showing the pre-calculated suitability indices (0-100%) either total or climate-only across Bera district Malaysia. The greener the overlay maps, the more suitable crops are to start planting in that month.
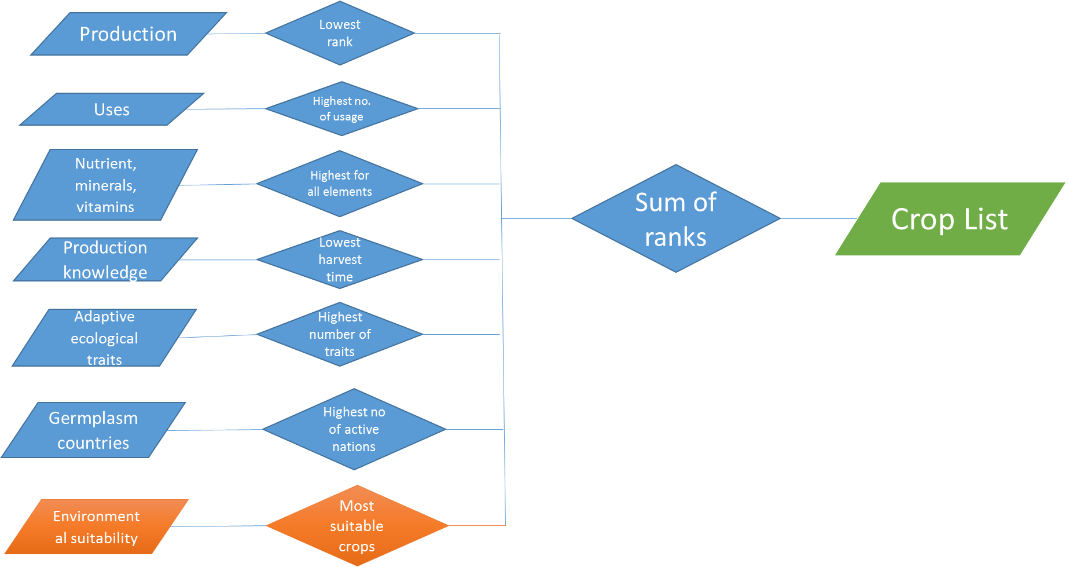
For each variable (protein content (mg/100g), harvest (days after planting), farm gate price (RM or USD)] we give a rank from highest to the lowest (according to the definition). The final rank is the sum of all the variable ranks. The schematics below shows the simple methodology.
a. Two stage simplified ranking:
- The process starts by the user selecting her area of interest. The system will extract the district in which the selected point is located. At the moment we provide crop options at the ‘district’ level.
- The system will then screen the crops in the database in terms of climate suitability indices and chooses 10 best crops according to climate suitability.
- At the next step the system will rank 10 crops according to user preferences (yield, income etc.)
b. One stage customised ranking:
- User will have freedom to combine climate suitability ranking (default) with any other criteria and any number of crops. This type of ranking will be extended to one stage ranking in the next iteration of the tool.
a. For simplification and demonstration purposes.
b. One stage customised ranking can provide unlimited ranking across many variables. For this iteration no climate screening is done for unlimited ranking. However the climate rank is combined by default in the final ranks. For the next iteration this facility will be upgraded to two stage ranking.
The next step is to provide a modelling choice for the selected crops to provide “yield” and “price” estimates at the chosen location.
a. Linux Operating System, Dell Servers
b. Various programming language and various cutting edge technologies for data processing and visualisations.
Yes the system is online on our server within our own domain.
The data and the tool will be provided on subscription basis and free for high level decision makers at the ministry and department level.
a. Yes at the moment you will need internet connection to access this system.
b. An offline demo version is available for demonstration purposes only.
a. We have tested some of the results of this tools (climate suitability only) in Dehiowita District of Sri Lanka and we received lots of interest from the local stockholders so far.
b. We have received positive response from international partners and funders over the extension of this tool in Africa.
a. Data: 2 month data collection
b. Development: 6 month “2 full time man power”
c. Scientists: 4 experts time amounting 2 month full time work
a. The system is using data from literature and other databases and technologies to avoid reinventing the wheel.
b. The feedback we have received so far from the local stakeholders has been positive regarding the two areas that this system excels:
- Organising crop specific knowledge/information in structured and accessible format
- Creating online analytics and modelling for yield and price/income estimates.
Depending on the scale and availability of data, extending the system to a new location will take 6 month to a year.
The system is being developed to be ‘mobile friendly’.
We have plans to extend the functionality of this system into a stand-alone app that can be used offline with an extension for data collection and user feedback.
Upgrades
a. Date
- Providing higher resolution (<1km) climate and soil suitability
- Text mining for automatic data collection from literature
- Integration with more databases on crops across value chain
- Curation and validation system
- Extend the localities and resolution of the system from district level to farm/plot level
- Extension of the system to stand alone mobile platforms
b. Development
- Inclusion of soil suitability index in overall ranking
- Extending the 10 best crops to unlimited number
- Giving the users more choice for screening the crops (Include 800+ variables in the selection algorithm)
- On the fly Online calculation for the climate, soil suitability
- On the fly modelling (yield and price)
- Develop data gap filling algorithm for missing data on crops